
There’s more to lacrosse than meets the eye, and Zack Capozzi of Lacrosse Reference is determined to use advanced data and metrics to tell part of the story.
In “Beyond the Basics,” Capozzi goes beyond the box score to talk about key strengths and weaknesses for each team in the USA Lacrosse Division I Women’s Preseason Top 20, which was announced earlier this month.
For a glossary of terms, head here. Otherwise, continue reading to learn more about each team.
1. BOSTON COLLEGE
43.4% overall efficiency
The Eagles soared on offense, topping the nation with a 43.4-percent overall opponent-adjusted efficiency. This leap from 39.6 percent the previous season was driven largely by improved ball security, with a turnover rate that dropped to 19.2 percent. In the end, it was a big factor in Boston College winning the title.
2. NORTHWESTERN
19.0% defensive efficiency
Northwestern’s defense took a step forward in 2024, improving its opponent-adjusted defensive efficiency to 19.0 percent and finishing third nationally on the defensive side of the ball. A big part of the success on that end was a firm policy of no second chances. The Wildcats limited opponents to 0.48 shots per possession (No. 2 nationally; only Stony Brook was better). Their defensive prowess was a bright spot, even in a season that didn’t quite match the heights of 2023.
3. MICHIGAN
6+ assists equals 44% scoring efficiency
In games against conference peers and similarly ranked teams, when the Michigan attack racked up six or more assists, it averaged a top percentile scoring efficiency of 44 percent. The Wolverines were 3-0 in those matchups. Less than 6 assists? Still solid, but efficiency was only 27 percent with a 5-3 record. If they could find open teammates, this offense was unstoppable.
4. NORTH CAROLINA
64.3% opponent-adjusted shot-on-goal rate
North Carolina’s 2024 defense was not the force it has been in recent years. The Tar Heels finished with the 33rd-best opponent-adjusted defensive efficiency. The last time they finished outside the top 10 was in 2018. But there was one area where they excelled: limiting opponents’ shots on goal. They boasted an impressive 64.3 percent opponent-adjusted shot-on-goal rate, placing them third in the country. If they can get their save percentage back to where it’s been in the past, another top-10 finish could be in the cards.
5. VIRGINIA
No. 6 strength of schedule
Virginia’s 2025 schedule projects as the sixth-toughest in the nation, a slight bump from last year’s seventh-toughest schedule. The most difficult stretch, from March 5-19, includes games against Richmond, North Carolina, Duke and James Madison. LaxElo projects 1.7 wins here. With a non-conference schedule that also includes Princeton, Navy and Maryland and projects as the 13th-toughest, there isn’t a lot of let-up in this schedule.
6. YALE
95th percentile assist rate
Freshman Ashley Kiernan made her mark for Yale with her exceptional playmaking ability, boasting a 95th percentile assist rate. While her shooting efficiency and ball security also showed promise (69th and 82nd percentile, respectively), it was her knack for setting up teammates that truly shined. The question for 2025 is whether she can get over the hump against the best defenses. In the Yale victories she played in, she averaged 1.5 assists per game, but in Yale’s three losses to Boston College, Denver and Syracuse, she failed to record a single helper.
7. JOHNS HOPKINS
40.8 shooting defense
Johns Hopkins made significant strides on the defensive front in 2024, with its shooting defense emerging as a cornerstone of its success. The Blue Jays improved their opponents’ shooting efficiency from 49.1 percent in 2023 to a stellar 40.8 percent, ranking seventh nationally. This defensive upgrade was a major factor in their climb to 24th in the LaxElo ratings, up from 28th the previous season.
8. LOYOLA
96th percentile shot-on-goal rate
The Loyola defense was a force to be reckoned with in 2024, ranking in the 96th percentile for adjusted shot-on-goal rate. Opponents struggled to even get their shots on cage, with an adjusted rate of just 64.9 percent. I tend to think of shot-on-goal rate as a measure of how comfortable an offense is, and it’s clear that Loyola was able to keep its opponents off balance all season.
9. FLORIDA
26.7% goals allowed between 20-40 seconds
Florida’s defense finished the year ranked 10th for opponent-adjusted efficiency. But that obscures some variance; the Gators were essentially a league-average defense on possessions that lasted at least 40 seconds. But on possessions that lasted less than 40 seconds, they allowed goals on just 16 percent of their possessions. If you could avoid a turnover in transition or early offense against Florida, your chance of scoring went way up.
10. MARYLAND
20.6% overall defensive efficiency
In 2024, Maryland’s defense showed substantial improvement with an overall defensive efficiency of 20.6 percent, ranking seventh nationally, a jump from 20th the previous year. This progress was largely driven by a significant reduction in opponents’ shooting percentage, which fell from 36.7 percent to 28.8 percent. The Terrapins’ defensive unit demonstrated a strong ability to disrupt opposing offenses, contributing to their rise in LaxElo ratings from No. 12 to No. 8.
11. SYRACUSE
70.7% draw-control win rate
Syracuse’s possession game played a big role in its success last season. Led by Kate Mashewske, the draw control win rate jumped from 63.3 percent in 2023 to 70.7 percent last season (third in the country). This improvement in the draw circle, along with success on the ride, translated to a per-game possession margin of plus-7.6, lifting the Orange from No. 30 to No. 7 nationally. With more possessions, they were able to control the tempo of games and put their offense in a great position to succeed.
12. PENN
18+ shots by attack unit
For Penn, getting its attack unit involved was key. The Quakers went 9-1 in games in which their attack took 18 or more shots, scoring on 34 percent of possessions. They went just 1-4 when the unit was less involved. And remember, I’m not even saying that these shots had to go in, just that they were taken. Now, that’s not to say their game plan should necessarily target more shots from the attack, but something about this offense worked better when the attack was firing away.
13. NOTRE DAME
26% turnover threshold
For Notre Dame, ball security on the offensive end was such a key metric in 2024. Specifically, keeping the turnover rate below 26 percent was the number to hit. Focusing on games against conference peers and similarly ranked teams, the Irish were 6-0 when they hit that mark and 2-4 when they didn’t. The difference in overall efficiency in those games was 16 percentage points (44 percent vs. 28 percent).
14. STONY BROOK
1st nationally in shots allowed per possession
On average, Stony Brook’s defense allowed opponents just 0.46 shots per possession. Think about that: over 10 defensive possessions, which could be a full quarter, the defense only let opponents take five shots. Not shots that reached the cage; shots in total. With a forced-turnover rate that put them fifth and an overall defensive efficiency that saw them finish ninth, their keepers were always ready, rarely needed.
15. NAVY
No. 4 non-conference strength of schedule
Navy’s 2025 schedule is not for the faint hearted, especially its non-conference slate, which ranks fourth in strength nationally. With challenging new matchups against Florida and Virginia, this lineup is a step up from last year’s 18th-ranked non-conference schedule. Navy was left out of the NCAA field last year in favor of Duke despite having a strength of record that was five spots ahead of the Blue Devils. This non-conference schedule suggests that the staff is determined to not be on the outside looking in.
16. DENVER
21% draw control experience returning
With only 21 percent of their draw control production returning from last year, the Pioneers have a tall task ahead. Losing Abby Jenkins, a top-tier draw specialist, leaves big shoes to fill. They are bringing in Maddie Montgomery, a transfer from William Smith who ranked in the 96th percentile for draw control production last season. Whether she can step in and help plug the gap for a unit that finished with the 16th-best true draw control win rate last season is a major question.
17. PRINCETON
No. 11 strength of schedule
Princeton’s 2025 schedule is shaping up to be a tough test, with a strength of schedule that projects as 11th nationally. That said, it looks slightly easier than last year’s schedule, which finished as the eighth toughest. Expect some exciting matchups, especially during a challenging April stretch with games at Cornell, versus Stony Brook and at Penn. The simulations predict a solid 9.5-5.5 record, which would see the Tigers likely fall in an RPI range of 11-22, similar to their No. 16 finish last year.
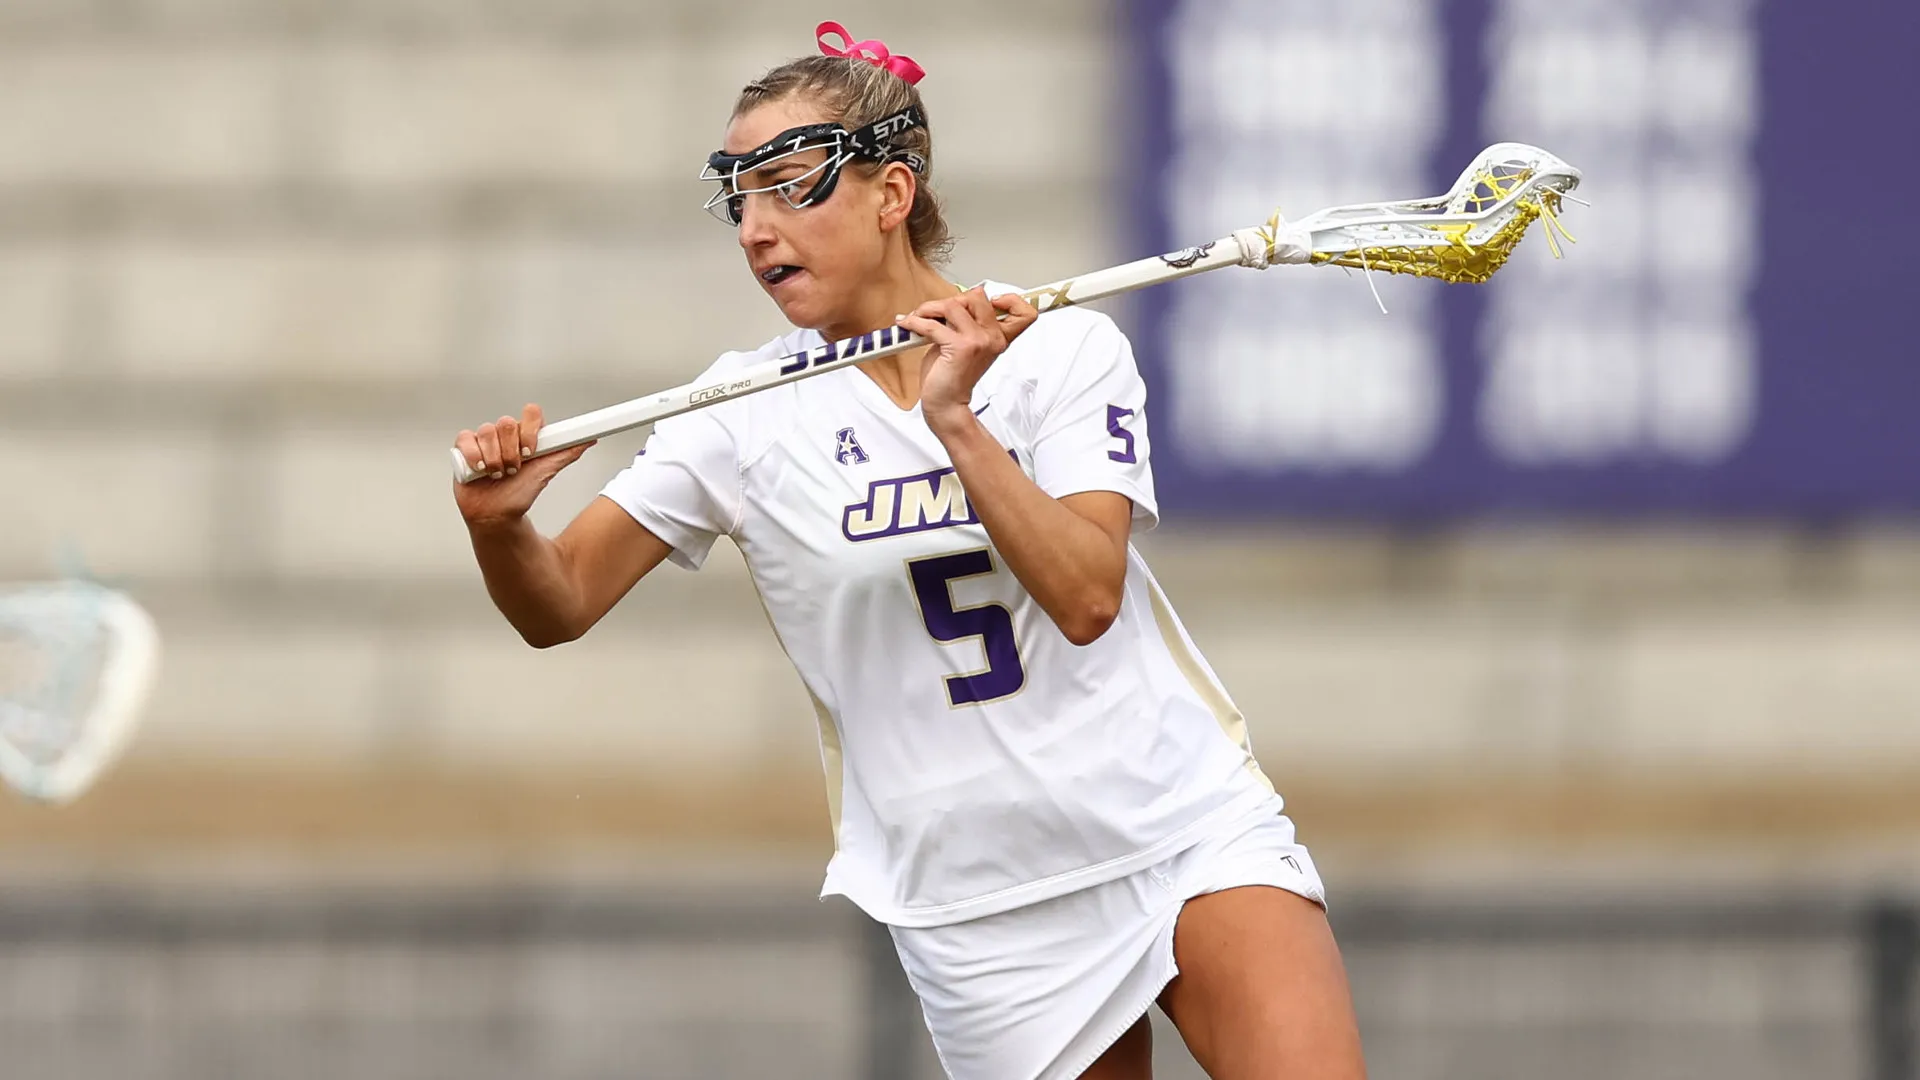
18. JAMES MADISON
12.4 wins and 3.6 losses projected
James Madison’s 2025 schedule highlights one of the big challenges of the LaxElo system: what to do with new teams.
LaxElo is a model that calculates a program strength rating for every team. When you win a game, you steal some rating points from the team you beat. The ratings of two teams can be used to calculate a win probability for every game. At the start, every team has a default rating of 1500. The system works great in general, but we know that new programs are, generally (but not always), worse than average.
LaxElo projects 12.4 wins against 3.6 losses for the Dukes in their 1 6-ame regular-season schedule. But thanks to the addition of two new programs (Charlotte and South Florida), JMU has not one, but two teams with a 1500 default rating. I don’t have any particular insight into either program, but if history holds, they’ll be below average, which would mean that the 12.4 projection underestimates how many wins JMU will end up with.
I’m working on some ideas that would make the model more responsive to brand new teams, but for the time being, if someone asks you whether the Dukes will hit 13 wins, you should probably say yes.
19. PENN STATE
96th percentile assist rate
Kelly MacKinney really turned heads in 2024 with her playmaking skills, boasting an impressive 96th percentile assist rate (she finished with 25 assists against just 15 turnovers). This knack for setting up teammates was a standout feature of her game, making her a crucial part of Penn State’s offense. She only took 5 percent of the team’s shots, but she rated as a slightly above average shooter. It’ll be interesting to see if she becomes more of a true dual threat in 2025.
20. USC
31% returning offensive production
USC faces a big challenge on offense heading into 2025, with only 31 percent of its production returning from last year. Losing a key player like Ella Heaney, who was in the top percentile for career assists, points and goals, means someone will have to step up. Isabelle Vitale, with her 78th percentile individual efficiency rating, might be the answer, but the road won’t be easy.